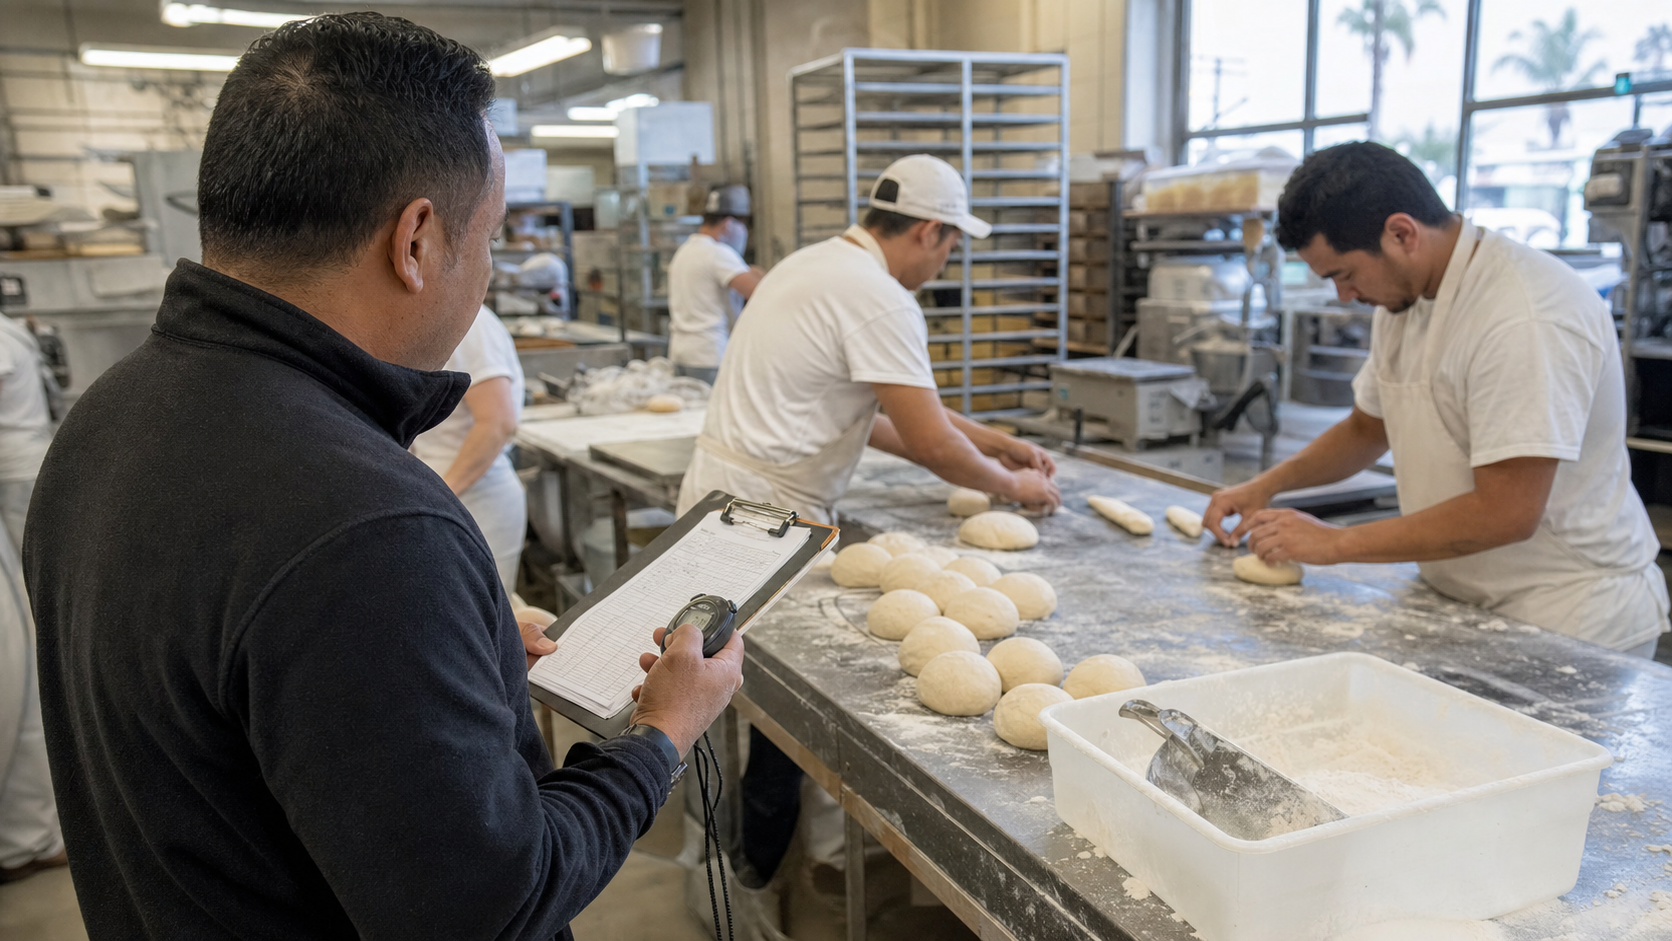
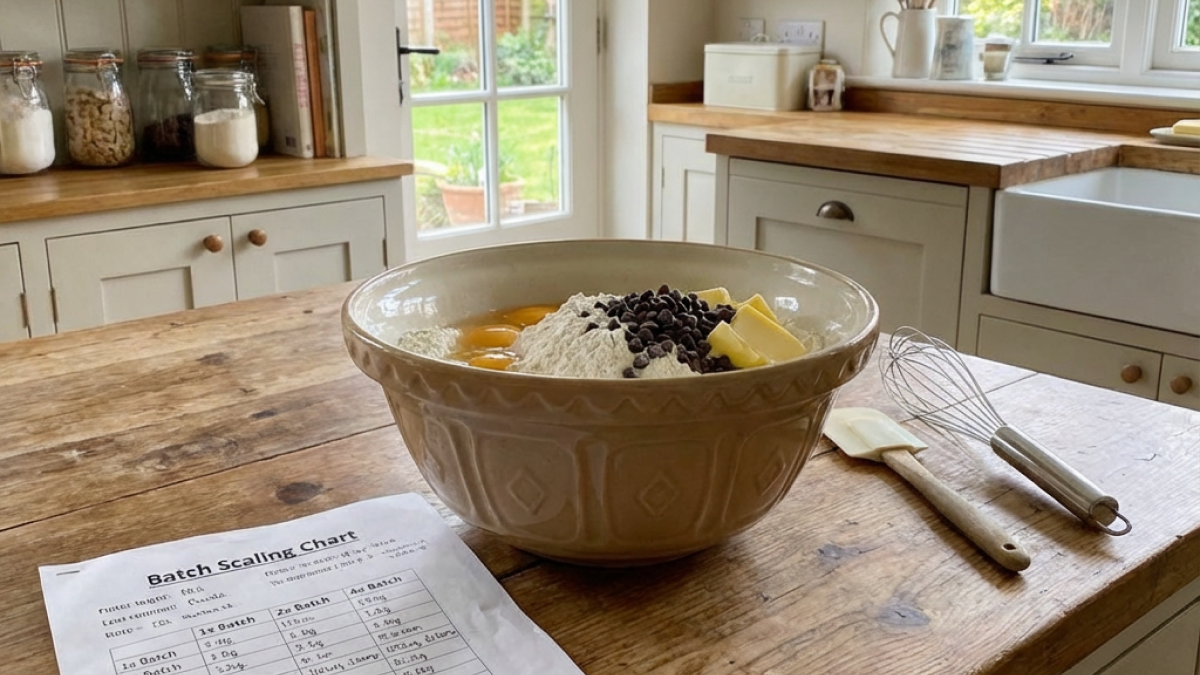
Recipe Yield, Batch Scaling, and Cost Accuracy
Published: August 29, 2025
There's a number in every recipe that most people take for granted: yield. "Makes 24 croissants." "Yields 6 loaves." "12 servings."
But that number is theoretical. It's what should happen if everything goes perfectly. Your actual yield is almost always different—and that difference has real cost implications.
Then there's scaling. Double a recipe and you'd expect costs to double. But scaling isn't always linear, and the non-linear parts can make or break your margins.
Let me explain why these numbers matter more than most bakeries realize.
Theoretical vs. Actual Yield
The Gap That Costs You Money
Your croissant recipe yields 24 pieces theoretically. Here's what happens in reality:
- Trimming loss during lamination: 2 croissants worth of dough
- Dough that sticks or tears: 0.5 croissant worth
- Shaping rejects: 1 croissant
- Baking casualties (overbrown, flat, blowouts): 0.5 croissant
Actual yield: 20 sellable croissants, not 24.
If you calculated your cost per croissant based on 24, you're underestimating by 17%. At $2.00 theoretical cost, your actual cost is $2.40.
Yield Loss Categories
Prep loss: Waste during ingredient preparation. Egg shells, vanilla bean caviar extraction, zesting.
Process loss: Dough that sticks to equipment, trimming waste, scraps that can't be reincorporated.
Handling loss: Damage during moving, shaping, panning.
Quality loss: Items that don't meet standards and can't be sold.
Baking loss: Moisture loss, items that burn or underbake.
Each category contributes to the gap between theoretical and actual yield.
Measuring Your Real Yield
You can't improve what you don't measure. For one week:
- Record theoretical yield for each recipe
- Count actual sellable units from each batch
- Calculate yield percentage: (Actual / Theoretical) × 100
- Note reasons for variance
You'll likely find:
- Some products hit 95%+ consistently
- Some products hover around 85-90%
- Some products have high variance (good days vs. bad days)
The low performers and high-variance items deserve attention.
How Yield Affects Costing
The Math
If your recipe costs $48.00 and theoretical yield is 24 units:
- Theoretical cost per unit: $48 / 24 = $2.00
If actual yield is 20 units:
- Actual cost per unit: $48 / 20 = $2.40
You're paying $0.40 more per unit than you thought. On 200 croissants daily, that's $80/day or ~$2,400/month in unrecognized cost.
Pricing Implications
Most bakeries price off theoretical costs. Then they wonder why margins are tighter than expected.
If you price that croissant at $3.50 expecting $2.00 cost (43% food cost), but actual cost is $2.40, your real food cost is 69%—dangerously thin margin territory.
The Recipe Costing Fix
Any recipe costing system—whether a food costing app free option or sophisticated software—should let you input actual yield, not just theoretical.
Better systems track both and show you the variance over time. You can see whether yield is improving, stable, or declining.
Batch Scaling Economics
Scaling a recipe from 1× to 2× doesn't always mean 2× costs. Here's why.
Linear Scaling (Ingredients)
Ingredient costs scale linearly. Double the flour, double the flour cost. This part is straightforward.
24 croissants → $6.00 in ingredients 48 croissants → $12.00 in ingredients 96 croissants → $24.00 in ingredients
Sub-Linear Scaling (Labor)
Labor doesn't double when you double batch size.
Consider croissant labor:
| Task | 24 units | 48 units | 96 units |
|---|---|---|---|
| Mise en place | 10 min | 12 min | 15 min |
| Mixing | 8 min | 10 min | 12 min |
| Lamination | 25 min | 35 min | 50 min |
| Shaping | 24 min | 48 min | 96 min |
| Baking supervision | 20 min | 25 min | 35 min |
| Packaging | 12 min | 24 min | 48 min |
| Total | 99 min | 154 min | 256 min |
| Per unit | 4.1 min | 3.2 min | 2.7 min |
Labor per unit drops as batch size increases. At $20/hour:
- 24 units: $1.37 labor per croissant
- 48 units: $1.07 labor per croissant
- 96 units: $0.89 labor per croissant
Setup and Teardown
These costs are mostly fixed regardless of batch size:
- Gathering ingredients
- Setting up equipment
- Cleaning afterward
A 15-minute setup spread across 24 units costs $0.21 each. Spread across 96 units, it costs $0.05 each.
Scaling Sweet Spots
Every recipe has an optimal batch size based on:
- Equipment capacity (mixer bowl, oven loads)
- Quality limits (dough handling, fermentation control)
- Storage constraints (proofing space, cooling racks)
- Demand patterns (can you sell that many?)
Beyond the sweet spot, efficiency gains flatten or reverse (quality issues, equipment strain).
Finding Your Sweet Spots
For each major product, identify:
- Minimum viable batch (below this, setup costs dominate)
- Optimal batch (best cost per unit)
- Maximum feasible batch (equipment/quality limits)
Schedule production at optimal batch sizes whenever demand allows.
Scaling Challenges
Scaling isn't just multiplication. Some factors don't scale linearly.
Mixing Behavior Changes
A mixer handles 5 kg of dough differently than 20 kg. Hydration, gluten development, and temperature all change with scale. Mixing times often need adjustment—they don't simply multiply.
Fermentation Dynamics
Larger dough masses retain heat differently. Your 3-hour bulk ferment at 24-portion scale might become 2.5 hours at 96-portion scale. Miss this and you've over-fermented an entire batch.
Handling Logistics
Moving a 5 kg dough mass is easy. Moving a 20 kg mass requires different technique, possibly different equipment. Handling time per unit might increase rather than decrease at large scales.
Oven Considerations
Four sheet pans fit in your oven. Scaling from 24 to 96 croissants means multiple bake cycles. Bake time per unit might stay flat or even increase as you wait for oven recovery between batches.
Quality Variance
Larger batches have more opportunity for error. A mistake in a 24-unit batch affects 24 units. A mistake in a 96-unit batch affects 96 units. Higher stakes mean higher stress and potentially more errors.
Building Accurate Cost Models
Given all this complexity, how do you build costing models that reflect reality?
Use Actual Yield in Calculations
Don't use recipe-stated yield. Use your documented actual yield for each product.
If your croissant recipe says 24 but you consistently get 21, cost based on 21.
Cost by Batch Size
Create separate cost cards for different batch sizes:
Croissant - 24 piece batch
- Ingredients: $6.00
- Labor: $33.00
- Packaging: $4.80
- Per unit: $1.83
Croissant - 48 piece batch
- Ingredients: $12.00
- Labor: $51.33
- Packaging: $9.60
- Per unit: $1.52
Croissant - 96 piece batch
- Ingredients: $24.00
- Labor: $85.33
- Packaging: $19.20
- Per unit: $1.34
This shows you the real economics of batch size decisions.
Track Yield Variance
Monitor yield over time. Look for:
- Declining yield: Recipe issue? Training issue? Ingredient quality?
- High variance: Inconsistency in process or personnel
- Improving yield: Training paying off? Process improvement working?
Yield isn't fixed. It can be improved—and it can degrade without attention.
Update for Real Production
Your cost model should reflect how you actually produce. If you make croissants in 48-unit batches on Tuesday and Thursday, use 48-unit batch costs.
If you occasionally make a 24-unit batch for a special order, know that those croissants cost more per unit.
Using This for Pricing and Planning
Pricing by Cost Reality
Price based on your actual production costs at typical batch sizes, with actual yields.
If 48-unit batches at 87.5% yield gives you $1.74 actual cost, price from there—not from the theoretical $1.50.
Batch Planning
Plan production in economically optimal batches:
If you need 70 croissants, should you make:
- Three 24-unit batches (72 croissants): $4.11/unit × 72 = $296
- One 48-unit batch + one 24-unit batch (72 croissants): ($1.52 × 48) + ($1.83 × 24) = $117
Same output, vastly different cost.
Minimum Order Logic
Use batch economics to set minimum orders for wholesale:
"Croissants are available in case quantities of 24, 48, or 96. Pricing decreases at higher quantities."
This encourages orders that align with your production efficiency.
Continuous Improvement
Yield and scaling efficiency aren't fixed. Improve them over time:
Reduce Process Loss
- Better bench technique (less sticking)
- Improved portioning consistency
- Quality tools (sharp cutters, proper scrapers)
Reduce Quality Loss
- Consistent proofing environment
- Temperature monitoring
- Better training and documentation
Improve Scaling Efficiency
- Equipment upgrades (larger mixer, additional oven capacity)
- Process documentation for different batch sizes
- Training for scaled production
Every percentage point of yield improvement flows directly to margin. 90% yield to 95% yield on $50,000 in monthly production saves ~$2,600 annually.
The Bottom Line
Yield and scaling are where theoretical recipe costing meets production reality. The gap between them—if you don't measure it—silently erodes your margins.
Know your actual yields. Understand your batch economics. Build cost models that reflect how you really produce.
Then you can price confidently, plan efficiently, and make decisions based on real numbers rather than assumptions.
Need a recipe costing system that handles yield tracking and batch-size cost modeling? Visit dicedos.com to see how our platform helps bakeries bridge the gap between theoretical recipes and actual production costs.
Related posts
Bakery Prep List by Station: Keep Mixing, Shaping, Baking, and Packing in Sync
Par-Baked and Frozen Dough Inventory for Bakeries: Control Stock Without Losing Freshness
Bakery Ingredient Price Variance Report: Catch Cost Changes Before They Hit Margin
Bakery Preventive Maintenance Calendar: Stop Equipment Issues Before the Rush