
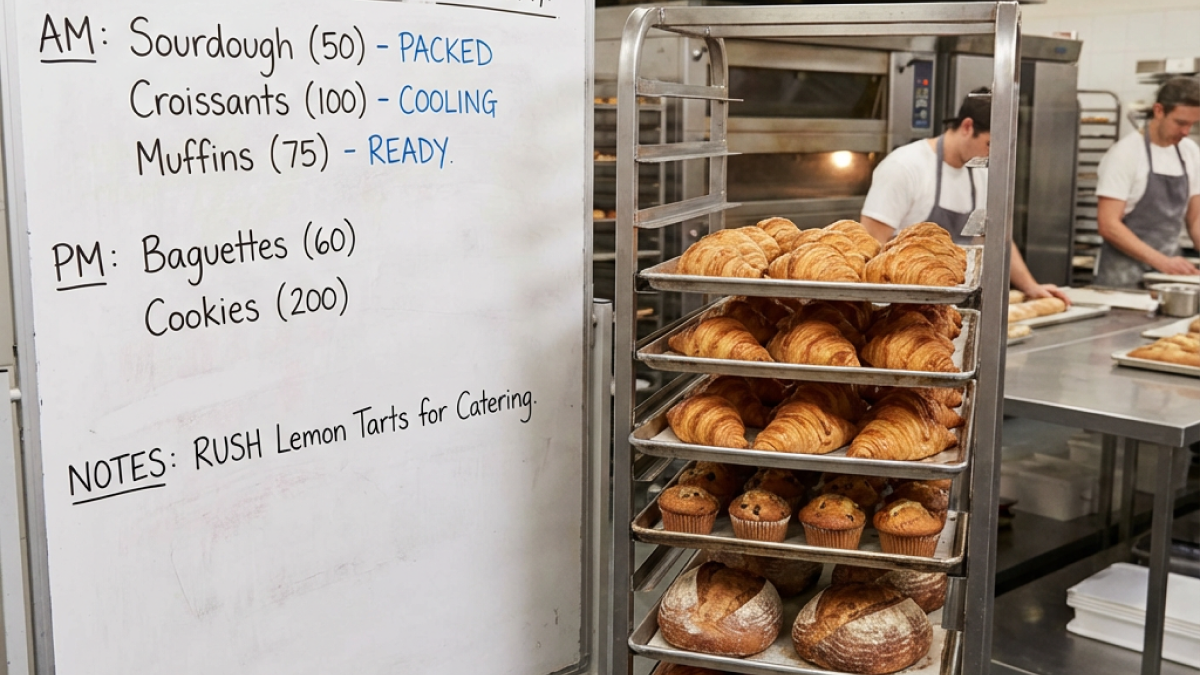
Batch Planning to Minimize Overproduction
Published: May 7, 2025
There's a painful moment at the end of every bakery day: looking at what didn't sell.
The croissants from this morning, now softening. The bread that's fine but won't be tomorrow. The cookies you made "just in case" that nobody wanted.
You can donate it, discount it, eat it, or throw it away. But none of those options recover the labor and ingredients you invested.
Overproduction is a margin killer. And while some unsold product is inevitable, the amount is very much within your control.
The Cost of Overproduction
Let's quantify what we're talking about.
A bakery producing 5% more than it sells doesn't sound terrible. But run the numbers:
Daily production cost: $1,200 5% overproduction: $60/day Monthly waste: $1,800 Annual waste: $21,600
That's real money—enough for a new oven, or three months of rent, or a decent salary.
And 5% is optimistic. Many bakeries run 10-15% overproduction, especially on items with variable demand.
Where Overproduction Hides
It's not always obvious:
- Production batches that don't divide evenly into demand
- Safety stock that rarely gets used
- Items that sell out sometimes, so you make extra "just in case"
- Wholesale quantities that exceed customer capacity
- Seasonal items made at peak-season volumes past peak
Each hiding spot has a solution. Finding them requires looking.
Understanding Your Demand
You can't plan production without knowing demand. Most bakeries have better demand data than they realize.
Historical Sales Data
Your POS records what sold. For each item, analyze:
- Average daily sales
- Day-of-week patterns (weekends vs. weekdays)
- Seasonal variations
- Trend direction (increasing, stable, declining)
Two months of data reveals patterns. A year of data reveals seasonality.
Wholesale Orders
For wholesale customers, demand is more predictable:
- Standing orders that repeat weekly
- Advance orders placed days ahead
- Historical ordering patterns by account
The unpredictability in wholesale comes from order modifications—which you can reduce by encouraging earlier ordering.
Retail Predictability
Retail feels random but often isn't:
- Coffee pastries sell in the morning rush
- Cookies sell steadily all day
- Bread sells late afternoon
- Weekend patterns differ from weekday
Track enough and you'll see the signal through the noise.
External Factors
Some demand variation is predictable:
- Weather (rain reduces foot traffic)
- Local events (festivals, sports, conventions)
- Holidays and school schedules
- Payday cycles in some neighborhoods
Build these into your forecasting.
Batch Sizing Strategy
Once you understand demand, size batches accordingly.
The Minimum Viable Batch
Every recipe has a smallest practical batch. Below that size:
- Setup costs dominate
- Quality may suffer
- Equipment doesn't work well (mixers need minimum volumes)
Know your minimums. Don't produce below them—instead, produce at minimum and accept occasional shortages or combine with other orders.
Demand-Matched Batches
Calculate the batch that covers expected demand with minimal excess.
Example: Croissants
- Average daily demand: 85 units
- Recipe batch size: 24 units
- Options: 3 batches (72) or 4 batches (96)
At 3 batches, you'll run short on above-average days. At 4 batches, you'll have 11 unsold on average days.
The choice depends on which problem is worse for your business.
Variable Batch Planning
Not every day needs the same production:
| Day | Expected Demand | Batches | Production |
|---|---|---|---|
| Monday | 65 | 3 | 72 |
| Tuesday | 75 | 3 | 72 |
| Wednesday | 80 | 4 | 96 |
| Thursday | 70 | 3 | 72 |
| Friday | 95 | 4 | 96 |
| Saturday | 120 | 5 | 120 |
| Sunday | 100 | 4 | 96 |
Monday gets lighter production. Saturday gets more. Match production to expected demand day by day.
The Safety Stock Question
How much buffer should you build in?
Arguments for higher buffer:
- Selling out frustrates customers
- Stockouts may drive customers to competitors
- Some items are brand identity—must always be available
Arguments for lower buffer:
- Unsold items are direct cost
- Slight scarcity can increase perceived value
- Sold out early signals popular items
Most bakeries over-buffer. A disciplined approach might accept running out of the last item by 3pm rather than making 15% extra.
Demand Forecasting Methods
Forecasting doesn't require sophisticated software. Simple methods work.
Moving Average
Average the last 4 weeks of sales. That's your baseline forecast.
Croissant sales last 4 Mondays: 62, 68, 65, 70 Monday forecast: (62+68+65+70)/4 = 66
Simple, stable, works for consistent items.
Weighted Average
Give more weight to recent data:
(62×1 + 68×2 + 65×3 + 70×4) / 10 = 67
More responsive to trends than simple average.
Seasonal Adjustment
If you have a year of data, calculate seasonal indexes:
November sales typically 85% of annual average. February sales typically 110% of annual average.
Apply these multipliers to your baseline forecast.
Manual Adjustment
Add human judgment:
- "Festival this weekend—add 20%"
- "School's out—expect 15% lower lunch sales"
- "Rain forecast—reduce 10%"
Data plus judgment beats either alone.
Production Scheduling
With forecasts and batch sizes determined, schedule production.
The Daily Production Plan
For each item:
- Target quantity (demand forecast + buffer)
- Batch size
- Number of batches
- Production timing
Organize by category (bread, pastry, cookies) and by timing (overnight, early morning, mid-day).
Lead Time Considerations
Some items require advance production:
- Sourdough: 24-36 hours before sale
- Laminated pastry: shape day before, bake fresh
- Cakes: baked and assembled in advance
Build lead times into your schedule. Thursday's sales of croissants were determined by Wednesday's shaping.
Flexibility Windows
Build in decision points:
- "Assess croissant sales at 10am. If on pace to sell out by noon, bake the backup batch."
- "If bread sales are slow by 2pm, don't make the late batch."
This reduces commitment to full production when demand is visibly lower than expected.
Reducing Waste From Overproduction
Even good planning produces some excess. Minimize its cost.
End-of-Day Protocols
Decide in advance what happens to unsold items:
| Item | End-of-Day Action |
|---|---|
| Croissants | Discount 25% starting 4pm |
| Bread | Donate or freeze for breadcrumbs |
| Cookies | Package for tomorrow (if appropriate) |
| Decorated items | Staff meal or dispose |
Having protocols prevents last-minute decisions and ensures consistent handling.
Repurposing Paths
Some items can become ingredients:
- Stale bread → breadcrumbs, croutons, bread pudding
- Day-old pastry → bread pudding, trifle
- Overripe fruit → jam, sauce, flavoring
Build these repurposing paths into your menu. If bread pudding is always available, stale bread always has value.
Discount Strategy
If you discount end-of-day items:
- Set consistent timing (after 4pm, not random)
- Use consistent discounts (25% or 50%, not negotiable)
- Display separately from full-price items
- Don't promote heavily (avoid training customers to wait)
Donation Partnerships
Establish relationships with:
- Food banks
- Shelters
- Community organizations
Having a pickup schedule means excess has somewhere to go consistently.
Tracking and Improving
What gets measured improves.
Waste Tracking
For each item, track daily:
- Produced
- Sold
- Wasted/donated/discounted
Calculate waste percentage: (Wasted / Produced) × 100
Target Setting
Set waste targets by category:
- Bread: Under 5%
- Pastry: Under 8%
- Cookies: Under 3%
- Decorated items: Under 2%
Items that consistently exceed targets need attention—either demand forecasting is off or batch sizing doesn't match reality.
Weekly Review
Each week, review:
- What items had highest waste?
- Were there patterns (certain days, certain items)?
- Did we run out of anything important?
- What adjustments should we make?
Small weekly improvements compound into significant annual savings.
Food Cost Analysis Integration
Connect waste tracking to your broader food cost analysis:
- Waste is part of actual food cost
- Theoretical cost assumes zero waste
- Variance includes waste plus other losses
When food cost percentage exceeds target, waste might be the culprit. Or might not—but you can only know if you're tracking.
Wholesale-Specific Considerations
Wholesale production has different dynamics.
Order-Based Production
Ideal: make exactly what's ordered. No overproduction possible.
Reality: Minimum batch sizes, production efficiency, and buffer for quality rejects mean some excess is inevitable.
Buffer Strategy for Wholesale
For standing orders, build modest buffer:
- 5% extra on items with quality variance
- Round up to batch quantities
- Hold buffer refrigerated/frozen when possible
Handling Over-Orders
Customer ordered 48, you made 60 to fill the batch.
Options:
- Retail the extra
- Freeze for next order
- Discount to another account
- Accept the waste as production cost
Advance Order Incentives
Encourage earlier ordering:
- "Orders by Tuesday noon guaranteed for Thursday delivery"
- Small discount for advance orders
- Priority fulfillment for predictable accounts
More advance notice means tighter production planning.
The Mindset Shift
Many bakers grew up with "better to have too much than run out." It's hospitality instinct—never disappoint a customer.
But running a sustainable business requires balancing hospitality against economics. A bakery that overproduces everything to ensure 100% availability might go out of business—then it can't serve anyone.
Selling out of an item at 2pm isn't failure. It's a signal of good planning and a reason for customers to come earlier tomorrow.
The goal isn't zero waste—that's unrealistic. The goal is minimum waste consistent with customer expectations and business sustainability.
Want to connect demand forecasting with production planning? Visit dicedos.com to see how our platform helps bakeries plan batches based on actual sales data and track waste to continuously improve.
Related posts
Bakery Prep List by Station: Keep Mixing, Shaping, Baking, and Packing in Sync
Par-Baked and Frozen Dough Inventory for Bakeries: Control Stock Without Losing Freshness
Bakery Preventive Maintenance Calendar: Stop Equipment Issues Before the Rush
Bakery Labor Standards by SKU: Know Which Products Eat the Schedule
