
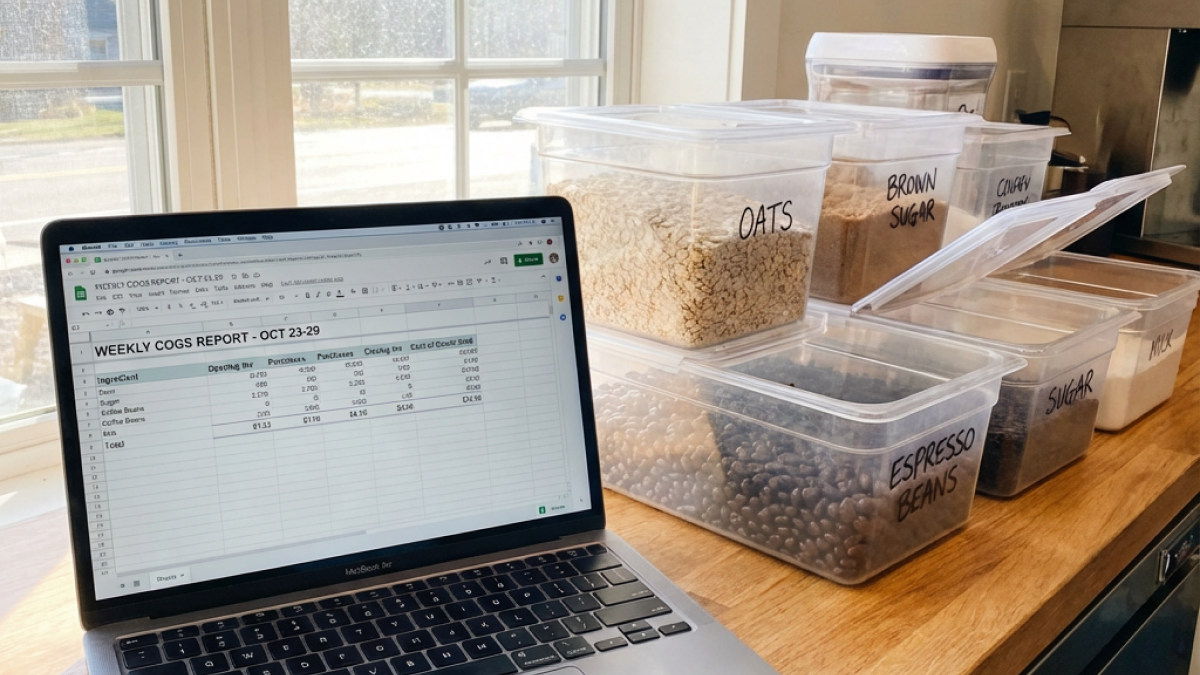
How to Build a Weekly COGS Report
Published: October 16, 2025
If you only look at your finances monthly, you're finding out about problems too late. By the time you see that your food cost percentage crept up 3 points, four weeks of damage is already done.
A weekly COGS report catches problems early. It shows you what you spent on ingredients this week relative to what you sold. Simple concept, powerful information.
Let me walk you through how to set one up—from structure to workflow to the mistakes that trip up most people.
What a COGS Report Actually Shows
COGS stands for Cost of Goods Sold. It's the direct cost of the products you sold during a period.
The weekly version answers: "What percentage of this week's revenue went to pay for ingredients?"
The Basic Formula
COGS % = (Beginning Inventory + Purchases - Ending Inventory) / Food Sales × 100
Beginning Inventory: What you had on hand at the start of the week (valued at cost) Purchases: What you bought during the week (from invoices) Ending Inventory: What you have on hand at the end of the week (valued at cost) Food Sales: Total revenue from food sales this week
The formula calculates how much inventory you consumed (beginning + purchases - ending) and expresses it as a percentage of what you sold.
Why Weekly, Not Monthly
Monthly reports are common because they align with accounting periods. But for operational management, monthly is too slow.
If your COGS jumps from 28% to 34% in week two, a monthly report won't tell you until week five. That's three weeks of elevated costs before you even know there's a problem.
Weekly reports surface issues while there's still time to act.
The Report Structure
A weekly COGS report doesn't need to be complicated. Here's a clean structure:
Header Section
- Report period (Week of [Date])
- Prepared by
- Report date
Inventory Section
| Item | Beginning | Purchases | Ending | Usage | Cost |
|---|---|---|---|---|---|
| Flour | $850 | $320 | $790 | $380 | |
| Butter | $420 | $560 | $385 | $595 | |
| Eggs | $185 | $210 | $175 | $220 | |
| ... | |||||
| Total | $3,250 | $2,890 | $3,050 | $3,090 |
Sales Section
| Category | Revenue |
|---|---|
| Bread | $4,200 |
| Pastry | $3,850 |
| Cookies/Bars | $2,100 |
| Other | $450 |
| Total Food Sales | $10,600 |
COGS Calculation
- Beginning Inventory: $3,250
- Plus Purchases: $2,890
- Less Ending Inventory: $3,050
- Cost of Goods Sold: $3,090
- Food Sales: $10,600
- COGS Percentage: 29.2%
Variance Section
| Metric | This Week | Last Week | 4-Week Avg | Variance |
|---|---|---|---|---|
| COGS % | 29.2% | 28.1% | 28.5% | +0.7% |
Notes
- Butter price increased mid-week (+$0.45/lb)
- Waste noted on Thursday (45 croissants unsold)
- New wholesale account started (higher volume, lower margin)
The Weekly Workflow
Building this report requires consistent weekly habits.
Sunday (or Your Week-Start Day)
Take ending inventory (which becomes next week's beginning inventory):
- Count all ingredients in storage
- Value at current purchase cost
- Record totals by category
This is the most time-consuming part—typically 30-60 minutes for a small bakery.
Throughout the Week
Record all purchases:
- Keep copies of all invoices
- Enter into tracking system or folder
- Note any price changes from previous invoices
Track any unusual events:
- Large waste incidents
- Quality issues requiring disposal
- Unusual sales patterns
End of Week
Gather data:
- Pull sales report from POS (total food sales)
- Collect all invoices (total purchases)
- Retrieve beginning inventory from last week's ending
Calculate:
- Beginning + Purchases - Ending = COGS
- COGS / Sales = COGS %
Analyze:
- Compare to last week and 4-week average
- Note significant variances
- Document explanations
Report:
- Complete the report document
- Share with stakeholders (owner, manager, accountant)
- File for historical reference
Time Investment
After initial setup, weekly COGS reporting takes:
- Inventory count: 30-60 minutes
- Data gathering: 15-20 minutes
- Calculation and analysis: 15-20 minutes
- Total: 60-100 minutes per week
For the operational visibility it provides, this is an excellent investment.
Inventory Counting Tips
The inventory count is where most errors originate. Do it well.
Consistent Timing
Count at the same time each week. Inventory levels fluctuate throughout a day—morning counts see more inventory, evening counts see less.
Organized Storage
If your walk-in is chaos, counting takes forever and accuracy suffers. Organize by category. Keep like items together.
Count Sheets
Use standardized count sheets with all items listed. Walking around looking for what to count misses items.
Two-Person Counting
When possible, one person counts and another records. Reduces errors from miscounting and mis-recording.
Value at Purchase Cost
Inventory should be valued at what you paid, not what you'll sell it for. Use your most recent purchase price for each item.
Handle Partial Units
Half a bag of flour still has value. Estimate partial quantities and include them.
Common Errors and How to Avoid Them
I've seen these mistakes many times.
Inconsistent Inventory Timing
Counting Sunday evening one week and Monday morning the next creates false variance. Pick a time. Stick to it.
Missing Invoices
That invoice stuffed in a pocket, that delivery without paperwork, that cash purchase from the farmers market—if they're not recorded, your purchases are understated and your COGS calculation is wrong.
Keep all invoices in one place. Review for completeness.
Forgetting Inventory Categories
You count flour and butter but forget about the nuts in the freezer, the chocolate chips in dry storage, and the fresh fruit in the walk-in.
Your count sheet should list everything. Walk every storage area.
Not Valuing Accurately
Guessing that "there's about $200 worth of flour" isn't counting. Weigh or count units, multiply by current cost.
Mixing Up Periods
The purchases that count are those received this week, not those ordered or paid. Align invoices with delivery dates.
Excluding Transfer Items
If you transferred ingredients between locations or wrote off waste, those movements affect inventory. Track them.
Rounding Too Much
Small rounding errors on individual items accumulate into significant total errors. Be precise during counting; round only in final presentation.
Reading the Report
Numbers are only useful if you act on them.
Normal Variance
Week-to-week COGS varies naturally. Sales mix shifts, purchases bunch up, inventory levels fluctuate. Variance of 1-2% in either direction is often normal.
Problem Signals
Investigate when you see:
- COGS percentage 3+ points above target
- Three consecutive weeks of increasing COGS
- Large unexplained swing from one week to next
Possible Causes of High COGS
Ingredient price increases: Check invoices for price changes Waste: Check waste logs; talk to production team Theft: Less common than assumed, but possible Over-portioning: Watch production for portion creep Inventory valuation errors: Recount suspicious items Sales mix shift: More low-margin items, fewer high-margin
Using the Notes Section
Always document explanatory factors:
- "Butter increased $0.45/lb this week"
- "Wholesale account returned $200 in damaged goods"
- "Weekend event required 50% more production"
These notes make variance analysis much easier—both this week and when reviewing historical data later.
Connecting COGS to Menu Profit Analysis
Weekly COGS tells you aggregate performance. Menu profit analysis tells you product-level performance.
If your COGS is running high, the menu analysis tells you which products are responsible:
- High-volume items with thin margins?
- Specific products with ingredient cost increases?
- Items with yield or waste problems?
The weekly COGS report is your alert system. Menu profit analysis is your diagnostic tool.
Using Both Together
- Weekly COGS shows elevated food cost percentage
- Menu analysis reveals croissant margins dropped from 35% to 28%
- Investigation shows butter cost increased but croissant price didn't
- Action: raise croissant price or find butter cost savings
Neither report alone gives you the complete picture.
Setting Up Your System
The Low-Tech Version
- Spreadsheet template (Google Sheets or Excel)
- Physical count sheets on clipboard
- Invoice folder (paper or scanned PDFs)
- POS export for sales data
This works. It's just manual and requires discipline.
The Integrated Version
A proper food cost calculator app can:
- Import invoices automatically
- Track inventory levels
- Pull sales data from POS integration
- Calculate COGS without manual formula work
- Alert when variance exceeds thresholds
More investment upfront, less weekly effort ongoing.
Start Where You Are
If you're doing nothing now, start with paper and spreadsheet. Get the habit established. Then consider upgrading tools.
A manual system you actually use beats sophisticated software you don't.
Targets and Benchmarks
What COGS percentage should you target?
General Bakery Ranges
- Wholesale bakeries: 25-35%
- Retail bakeries: 28-38%
- Bakery-cafes: 30-40%
Higher food cost isn't always bad—it might indicate premium ingredients that support premium pricing. Lower isn't always good—it might mean sacrificing quality or underpricing.
Your Specific Target
Based on your business model:
- Calculate your breakeven COGS (what allows covering labor, overhead, and profit)
- Research comparable bakeries in your market
- Set a target range (e.g., 28-32%)
Track variance from your target, not just from last week.
The Discipline of Weekly Reporting
Here's the honest truth: weekly COGS reporting only works if you do it every week.
Skip a week and you've lost the comparison baseline. Skip two weeks and the habit breaks. Skip a month and you're back to flying blind.
Making It Stick
- Block time on your calendar
- Make it part of a weekly management meeting
- Assign accountability (even if to yourself)
- Create consequences for missing (donation jar?)
The bakeries with the best cost control are the ones that made this a non-negotiable practice.
Want to understand your true costs without manual spreadsheet work? Get our free costing template at dicedos.com/freetemplate, or explore how our platform helps you track recipe costs and profitability.
Related posts
Why Cost Management Matters for Small Bakeries: The Complete 2025 Guide
Bakery Prep List by Station: Keep Mixing, Shaping, Baking, and Packing in Sync
Bakery Standing Orders for Wholesale Accounts: Keep Recurring Deliveries Accurate
Bakery Lot Traceability: A Practical Recall-Ready System for Small Teams
