Predictive Analytics for Better Seasonal Bakery Sales
Published: August 17, 2025
Every spring, you'll make a decision about what goes on your seasonal menu. You'll add new items, remove others, and bet production capacity on choices that will either pay off or sit unsold in your case.
Most bakeries make these decisions based on instinct, what was popular last year, and whatever ingredients their supplier is pushing.
That's leaving money on the table.
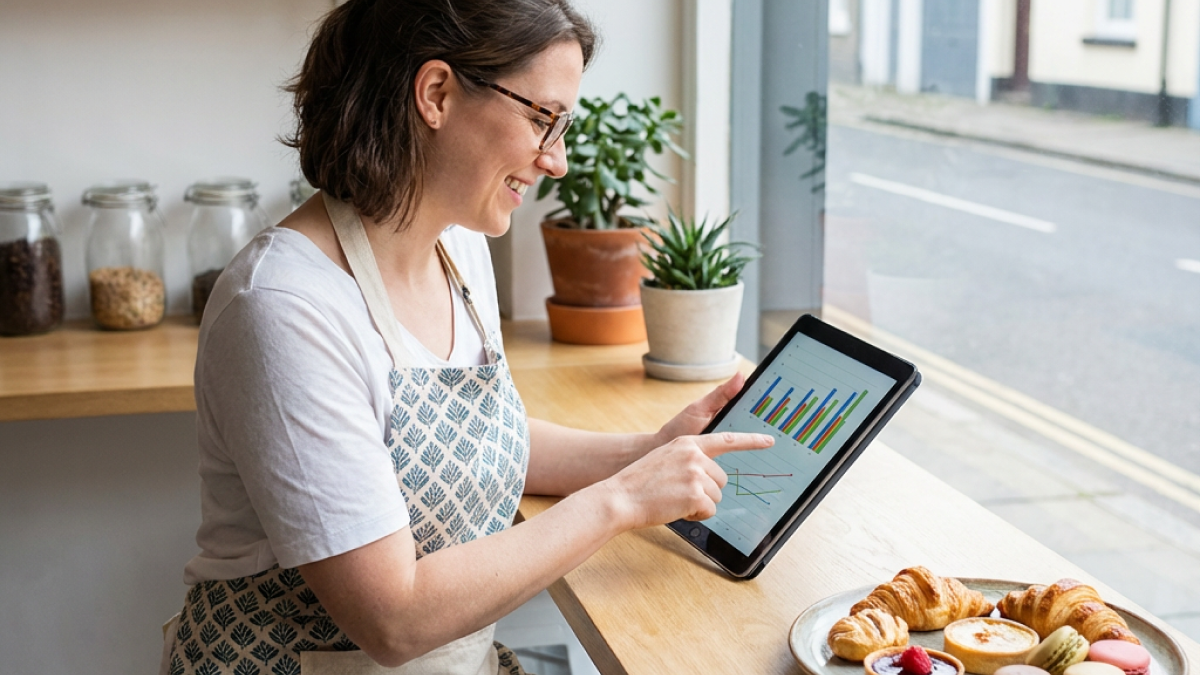
Predictive analytics—using data to forecast what will perform—doesn't require sophisticated software or a data science degree. It requires paying attention to the right signals and combining them with what you already know about your customers.
What "Predictive Analytics" Actually Means for Bakeries
Let's demystify this.
Predictive food trend analytics, for a small bakery, means gathering information about what's likely to sell well before you commit production resources to making it.
This isn't big data. It's asking: what do I know, and what can I find out, that helps me make better seasonal decisions?
The Three Types of Predictive Information
Historical data: What happened last time. Your own sales from previous seasons, year-over-year patterns, what succeeded and what flopped.
Trend signals: What's gaining momentum in the broader market. Industry reports, social media, food media coverage, competitor activity.
Local context: What's unique to your market. Customer demographics, regional preferences, local events and timing.
Combining these three gives you a clearer picture than any one alone.
Using Your Historical Data
The most valuable predictive data is data you already have.
Same Season, Previous Years
Pull your sales data from last spring, summer, fall, or winter (whichever season you're planning). Look at:
Top performers by volume: What sold the most units? Top performers by profit: What contributed most to margins? Velocity patterns: When did seasonal items peak? How long was the window? Launch vs. end-of-season: Did items perform consistently or fade after initial interest?
Product-Level Insights
For each seasonal item you've offered before:
| Question | What It Tells You |
|---|---|
| Did it sell better than baseline items? | Whether "seasonal" actually drove sales |
| Did it maintain interest or fade? | How long to offer it |
| Did it require significant production changes? | Whether complexity was worth it |
| Did customers ask for it back? | Genuine demand vs. novelty |
Pattern Recognition
Look for patterns across multiple years:
- Do fruit items consistently peak mid-summer?
- Does pumpkin sell better in September or October?
- Does demand for "cozy" items start before temperatures actually drop?
- Are holiday items requested earlier each year?
These patterns likely continue. Plan accordingly.
Reading Trend Signals
Historical data tells you what happened. Trend signals tell you what's changing.
Industry Sources
National Restaurant Association publishes annual trend reports. While restaurant-focused, bakery-relevant insights include flavor directions, dietary trends, and consumer behavior shifts.
Specialty Food Association tracks emerging ingredients and categories. Their "trendspotter" panel identifies what's moving from niche to mainstream.
Bakery trade publications (Bake Magazine, Modern Baking) cover what larger bakeries are launching—useful signals for what's percolating.
Google Trends
Free and underutilized. Search for seasonal item ideas and compare interest over time.
Compare "lavender scone" vs. "earl grey scone" vs. "matcha scone" and see which has growing search interest heading into spring.
Look at geographic data—is your region more interested than national average?
Check timing—when does interest start rising? That's your launch window.
Social Media Signals
Instagram, TikTok, Pinterest show what food content is engaging audiences:
- What flavors are food accounts featuring?
- What pastries are getting shared?
- What visual styles are trending?
This isn't about copying trends blindly. It's about understanding what's resonating with the audience you're trying to reach.
Supplier Intel
Your ingredient suppliers see the whole market. They know:
- What ingredients are becoming available
- What other bakeries are ordering
- What new products are launching
Ask them. "What are you seeing in seasonal demand this year?" is a valuable question.
Local Context Factors
National trends matter less than local reality.
Your Customer Demographics
A bakery serving college students prioritizes differently than one serving suburban families or tourists. Consider:
- Age profile of your customers
- Income level and price sensitivity
- Health consciousness vs. indulgence preferences
- Cultural background and flavor preferences
- Social media engagement (do they photograph food?)
Local Events and Timing
What's happening in your area that affects seasonal timing?
- Does the local university schedule affect traffic patterns?
- Are there festivals, events, or holidays unique to your region?
- Does tourism season shift seasonal demand earlier or later?
- Do weather patterns in your area differ from national norms?
A beach town bakery might extend summer menu through October. A ski town might run winter items into April.
Competitive Landscape
What are other bakeries and cafes in your market doing?
- Where is there whitespace you could fill?
- Where is there oversaturation you should avoid?
- What quality level are competitors offering?
If every bakery in town is doing pumpkin everything, maybe you're better served with apple or pear. Or maybe pumpkin is so expected that you must have it—but differentiate the execution.
Building Your Seasonal Forecast
Combine your information sources into actual decisions.
Step 1: Define the Season
When does this season start and end for your customers? Not calendar dates—actual behavior shifts.
For fall, this might be:
- Interest begins: late August
- Peak period: mid-September through October
- Fade-out: November (transition to holiday)
Step 2: List Candidate Items
Brainstorm potential seasonal offerings based on:
- Historical performers you'd bring back
- Trend-driven new ideas
- Customer requests you've received
- Supplier-highlighted ingredients
Aim for 2-3x more candidates than you'll actually launch. Abundance gives you choices.
Step 3: Score Each Candidate
Rate each candidate on:
| Factor | Score 1-5 |
|---|---|
| Historical performance (if applicable) | |
| Trend alignment | |
| Production fit (uses existing skills/equipment) | |
| Ingredient availability and cost | |
| Margin potential | |
| Differentiation from competitors | |
| Customer segment fit |
Add scores. Higher totals are stronger candidates.
Step 4: Model the Economics
For top candidates, project:
- Expected units per week
- Ingredient cost per unit
- Selling price and margin
- Production labor requirements
- Inventory risk if items don't sell
This converts trend optimism into business reality.
Step 5: Plan the Test
Don't launch all seasonal items at full volume. Plan a test phase:
- Limited initial production
- Defined success criteria
- Timeline for scale-up decision
Testing protects against overconfidence.
Timing Your Seasonal Launch
When you launch matters as much as what you launch.
Early vs. Mainstream vs. Late
Early launchers (before the season "officially" starts):
- Capture enthusiasm of trend-forward customers
- Risk lower initial volume as most people aren't thinking seasonal yet
- Position as a leader rather than follower
Mainstream timing (when the season is in full swing):
- Maximum audience ready for seasonal items
- More competition—everyone else is launching too
- Clear demand signals, less risk
Late launchers (toward end of season):
- Capture customers who haven't indulged yet
- Risk audience fatigue—"pumpkin everything" is exhausting by November
- Can respond to what actually worked in the market
There's no universally correct timing. It depends on your brand position and customer expectations.
The Launch Calendar
Map out your seasonal menu calendar for the full year:
| Season | Scout | Test | Launch | Peak | Fade |
|---|---|---|---|---|---|
| Spring | Jan | Feb | Mar | Apr-May | Jun |
| Summer | Apr | May | Jun | Jul-Aug | Sep |
| Fall | Jul | Aug | Sep | Sep-Oct | Nov |
| Holiday | Sep | Oct | Nov | Dec | Jan |
Working backward from launch dates tells you when to be researching, testing, and deciding.
Measuring and Learning
Predictive analytics only improves if you close the loop.
Track What Actually Happens
For each seasonal item:
- Daily/weekly unit sales
- Revenue and profit contribution
- Customer feedback
- Production challenges
- Waste levels
Compare to Predictions
At season's end, review:
- How did actual performance compare to forecast?
- Which signals were accurate predictors?
- Which signals led you astray?
- What would you do differently?
Build Your Playbook
Document what you learn. Next year's planning should start with:
- "Here's what worked last year"
- "Here's what didn't"
- "Here's what we predicted vs. actual"
Over time, your predictions improve because your data improves.
The Mindset: Informed Intuition
Predictive analytics doesn't replace baker's intuition. It informs it.
You know your customers. You know your products. You have instincts about what will work.
Data helps you test those instincts before betting production resources. It helps you catch blind spots—things you're sure will work that won't, or things you're ignoring that deserve attention.
The bakeries that win at seasonal planning combine creative instinct with analytical rigor. They bring the art of baking and the science of prediction together.
That's not "analytics" in some corporate sense. That's just smart baking.
Want to track seasonal performance and predict better for next year? Visit dicedos.com to see how our platform helps bakeries turn historical data into actionable insights for seasonal menu planning.