
Data-Driven Menu Decisions for Small Bakeries
Published: June 30, 2025
Every bakery owner has an opinion about what sells. Often that opinion is wrong—shaped by which products you enjoy making, which customers are loudest, and which items you happen to notice moving.
I've watched bakeries discontinue their most profitable items because "nobody buys them" (actually: they sold steadily but quietly) and keep money-losers on the menu because one regular customer asks for them weekly.
Data cuts through these biases. It tells you what's actually happening, not what you think is happening. And for small bakeries competing against chains with sophisticated analytics departments, using data wisely might be your biggest advantage.
The Data You Already Have
Before investing in fancy analytics tools, recognize what you're already collecting:
Point-of-Sale Data
If you use Square, Toast, Clover, or any modern POS, you have:
- Sales by item, by day, by hour
- Average transaction size
- Items frequently purchased together
- Seasonal comparison (this January vs. last January)
- Payment method breakdowns
Most bakeries never look at these reports. They're sitting there, waiting.
Production Logs
Even handwritten bake sheets contain data:
- What you made each day
- Waste at end of day
- Which items ran out (and when)
- Who made what (if you track by baker)
Customer Feedback
Comments, complaints, questions. What do people ask for that you don't carry? What do they compliment? What do they avoid?
Supplier Invoices
Price changes over time. Which ingredients are volatile. Where costs are trending.
This isn't big data. It's information small bakeries have always generated but rarely analyzed systematically.
Building Your Decision Framework
Data without a framework is just noise. Here's how to organize information for menu decisions:
The Profitability Layer
For every item on your menu, calculate:
Cost per unit: Ingredients + labor + packaging + overhead allocation Margin dollars: Selling price minus cost Margin percentage: Margin dollars divided by selling price Weekly/monthly profit contribution: Margin dollars times units sold
This tells you which products actually make money.
The Velocity Layer
How fast does each item move?
Units per day/week: Raw volume Sell-through rate: Units sold divided by units produced (inverse of waste) Time to sell-out: How long until you run out Day-of-week patterns: Does this item sell better on weekends?
This tells you which products your customers want.
The Efficiency Layer
How hard is each item to produce?
Labor time per unit: Active production time Oven utilization: Units per oven cycle Batch flexibility: Can you make 12 or 200 equally well? Ingredient overlap: Does this share components with other products?
This tells you which products fit your operation.
Putting It Together
A product that's high-profit, high-velocity, and high-efficiency is a star. Keep it.
A product that's low on all three is dead weight. Cut it.
Everything in between requires judgment—but now it's informed judgment based on data, not hunches.
Seasonal Menu Development
Seasons affect bakeries more than most food businesses. Summer means stone fruit and lighter fare. Winter means warming spices and comfort items. Holiday periods spike certain categories.
Using Historical Data
Look at last year's sales by month:
- Which items peaked when?
- Which items slumped?
- Were there surprise performers?
If your pumpkin muffins outsold everything in October last year, plan for that. If your fruit tarts died in January, stop making them in January.
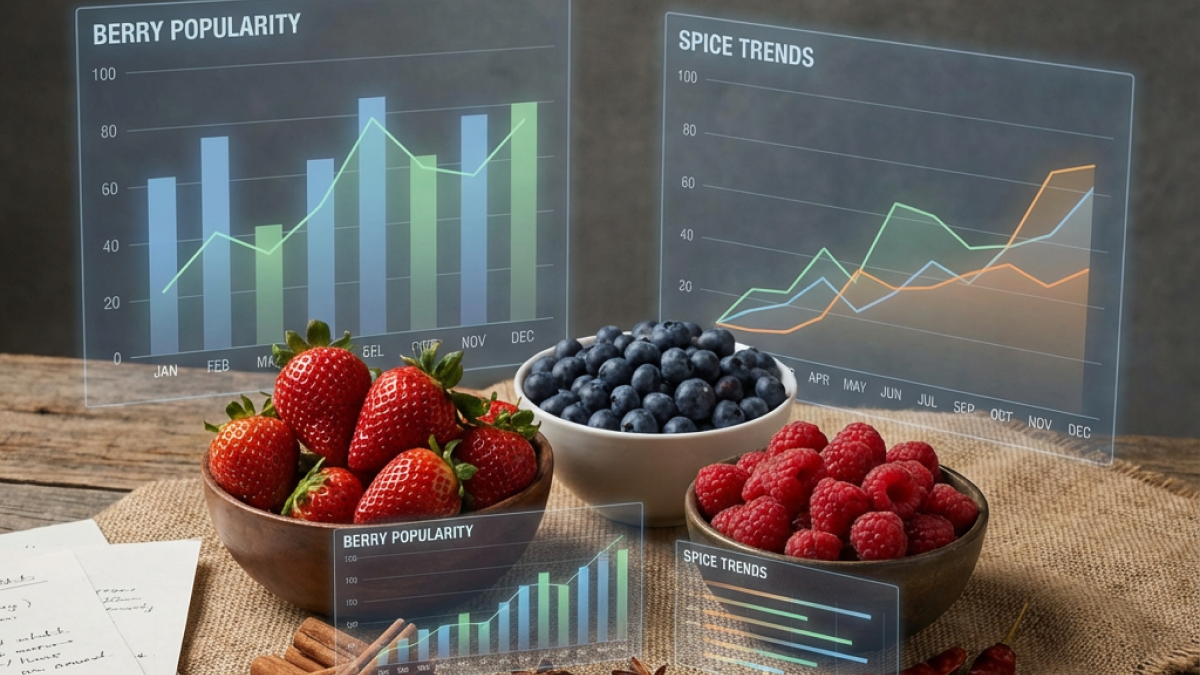
Predictive Food Trend Analytics
Sounds fancy, but it's really just paying attention:
Google Trends: Search interest for menu items by season Industry reports: NRA, specialty food associations publish trend reports Social media: What are food accounts featuring? Competitor watching: What are successful bakeries launching?
Combine trend signals with your historical data. If lavender is trending AND your lavender shortbread performed well historically, lean into it this spring.
Planning the Transition
Don't flip menus overnight. Transition gradually:
4-6 weeks before season: Test new items in small batches 2-4 weeks before: Gather feedback, refine recipes Season start: Feature new items prominently Season end: Phase out slowly, don't abruptly discontinue
This gives you data on new items before committing production capacity.
Reading Sales Patterns
Raw sales numbers tell part of the story. Patterns tell more.
Day-of-Week Analysis
Pull your POS data by day of week for the past 3-6 months. You'll likely see:
- Weekend spikes for breakfast items
- Monday drops overall
- Friday increases for "treat yourself" items
- Consistent weekday patterns for coffee-paired pastries
Adjust production accordingly. If croissants sell 40% more on Saturday, make 40% more on Saturday. If muffins are flat all week, produce consistently.
Time-of-Day Patterns
When do items sell?
- Morning rush: Coffee pastries, grab-and-go
- Late morning: Indulgent items, second breakfast
- Lunch: Sandwiches, savory items
- Afternoon: Sweet treats, cookies
- End of day: Discounted items, bread for dinner
If your afternoon is dead, maybe you don't need items that only appeal after 2pm. If your morning rush clears your croissant case, make more croissants.
Basket Analysis
What do people buy together?
- Croissant + coffee
- Bread + pastry (weekend "stock up" behavior)
- Cookie + second cookie (for someone else?)
If you notice patterns, encourage them. "Get a cookie with your croissant for $1.50" works better when you know people already tend to buy both.
Customer Feedback as Data
Feedback feels qualitative, but you can quantify it.
Track Requests
Keep a running list of items customers ask for. After a month, look for patterns:
- 15 people asked about gluten-free options
- 8 people wanted vegan pastries
- 12 people asked if you have sandwiches
That's data. It might justify menu additions or confirm that demand exists for something you've considered.
Track Complaints
Similarly:
- 6 complaints that scones were dry
- 4 complaints about pricing
- 3 comments that the line was too long
Some complaints are actionable (fix the scones). Some are noise (the one person who always complains). Data helps you distinguish.
Survey Strategically
Don't survey constantly—customers tune out. But periodic targeted surveys work:
"We're considering adding savory items. Would you order quiche if we carried it?" "We're testing new croissant flavors. Rank these options 1-5." "What would make you visit more often?"
Keep surveys short (3-5 questions max) and offer an incentive (free coffee, 10% off).
Making the Cut: When to Discontinue
One of the hardest decisions: dropping an item from the menu.
Data makes it easier. Here's a framework:
Candidate for removal if:
- Bottom 20% in profit contribution
- Less than 5 units sold per week
- Requires unique ingredients not used elsewhere
- Disproportionate production complexity
- Negative or below-target margin
Keep despite poor numbers if:
- Drives traffic (loss leader)
- Part of a profitable bundle
- Required by a key wholesale account
- Core to brand identity
- Seasonal (judge it in-season, not off-season)
Process for discontinuation:
- Confirm data for 4+ weeks (avoid reacting to one bad week)
- Check for explanations (out of stock? quality issues? display problems?)
- Make the decision
- Stop production (don't announce—most customers won't notice)
- Evaluate after 4 weeks (did anyone complain? did anything shift?)
Most bakeries carry 15-20% dead weight they're afraid to cut. The items take up case space, require ingredient inventory, and consume production time—all for minimal return.
Adding New Items: The Data-First Approach
Before adding something because it "seems like a good idea":
Estimate the Market
- How many units might sell per day/week?
- At what price point?
- Who's the target customer?
Calculate the Economics
- What will it cost to produce?
- What margin can you achieve?
- Does it require new equipment or ingredients?
Plan the Test
- How many will you make for initial test?
- Over how long?
- What defines success?
Run the Test
- Track sales vs. projection
- Note customer reactions
- Document production challenges
Decide
- Did it meet targets? Keep it.
- Close but not quite? Adjust and retest.
- Failed clearly? Don't launch.
This approach kills most bad ideas before they consume real resources. The ones that survive are more likely to succeed.
Simple Tools for Small Bakeries
You don't need enterprise software to be data-driven:
Spreadsheet for menu matrix: Products × metrics (cost, price, margin, velocity). Update monthly.
POS reports: Most systems have built-in reporting. Spend 30 minutes weekly reviewing.
Production log: Paper or digital, track what you made and what wasted.
Request/feedback log: Simple tally sheet for customer input.
Monthly review meeting: Even if it's just you, schedule time to look at the data and make decisions.
The goal isn't perfect analysis. It's better-than-gut decisions based on actual information.
Seasonal Menu Planning with Data
Let me walk through a practical example of seasonal menu development:
Step 1: Review Last Spring's Data
Pull March-May sales from last year:
- Which items peaked?
- Which items dropped?
- What was the margin profile?
Say your lemon bars doubled in April, your chocolate croissants dropped 20%, and your carrot cake maintained steady sales.
Step 2: Identify Trends
Look at what's trending this spring:
- Yuzu and Asian citrus flavors are appearing everywhere
- Floral flavors (lavender, rose) continue strong
- "Healthier" positioning for spring items
Step 3: Plan Your Menu
Based on data + trends:
- Keep lemon bars, maybe test a yuzu variation
- Reduce chocolate croissant production in spring (shift capacity elsewhere)
- Add a lavender scone (test first)
- Keep carrot cake (reliable performer)
Step 4: Set Targets
- Lemon/yuzu bars: 15% sales increase over last spring
- Lavender scone: 10 units/day within first month
- Overall spring seasonal items: 25% of category sales
Step 5: Measure and Adjust
Week 2: Lavender scone at 6/day, below target. Is it placement? Pricing? Recipe? Investigate. Week 4: Yuzu bars outperforming regular lemon. Consider replacing entirely. Week 6: Review all seasonal items, make mid-season adjustments.
This is seasonal menu planning based on data rather than hope.
The Mindset Shift
Being data-driven doesn't mean ignoring intuition. It means testing intuition against reality.
You think the new cake will be a hit? Great—test it and see. You feel like croissant sales are down? Check the numbers. A customer suggests you add sandwiches? Track how many times you hear that.
Data gives you feedback. It tells you when your instincts are right and when they're leading you astray.
For small bakeries, where every product decision affects cash flow and every wasted batch hurts, this feedback is invaluable.
Use it.
Want to see your bakery data in one place? Visit dicedos.com to discover how our platform connects sales, production, and profitability data for smarter menu decisions.