Bakery Production Variance Report: Compare Planned vs. Actual Output
Published: June 4, 2026
Every bakery has a plan before production starts. The real question is whether the day ended close to that plan.
A production variance report compares planned output to actual output so the team can see where the bake changed, why it changed, and what needs to improve.
Without variance reporting, the same problems repeat: short counts, excess product, overtime, missing ingredients, and unclear explanations.
What Production Variance Means
Production variance is the gap between what you planned and what actually happened.
Basic formula:
`text Production variance = Actual output - Planned output `
Variance percentage:
`text Variance % = Production variance / Planned output `
If the plan called for 240 rolls and production finished 216, the variance is -24 rolls, or -10%.
That number should trigger a question: was the plan wrong, the yield low, the batch short, or the count inaccurate?
Track the Right Variance Types
Do not limit the report to finished units.
Useful variance categories include:
- planned units vs. actual units
- planned dough weight vs. actual dough weight
- expected yield vs. actual yield
- planned labor hours vs. actual labor hours
- planned oven time vs. actual oven time
- planned waste vs. actual waste
- ordered quantity vs. shipped quantity
The best report shows where the day changed, not just whether the final count was off.
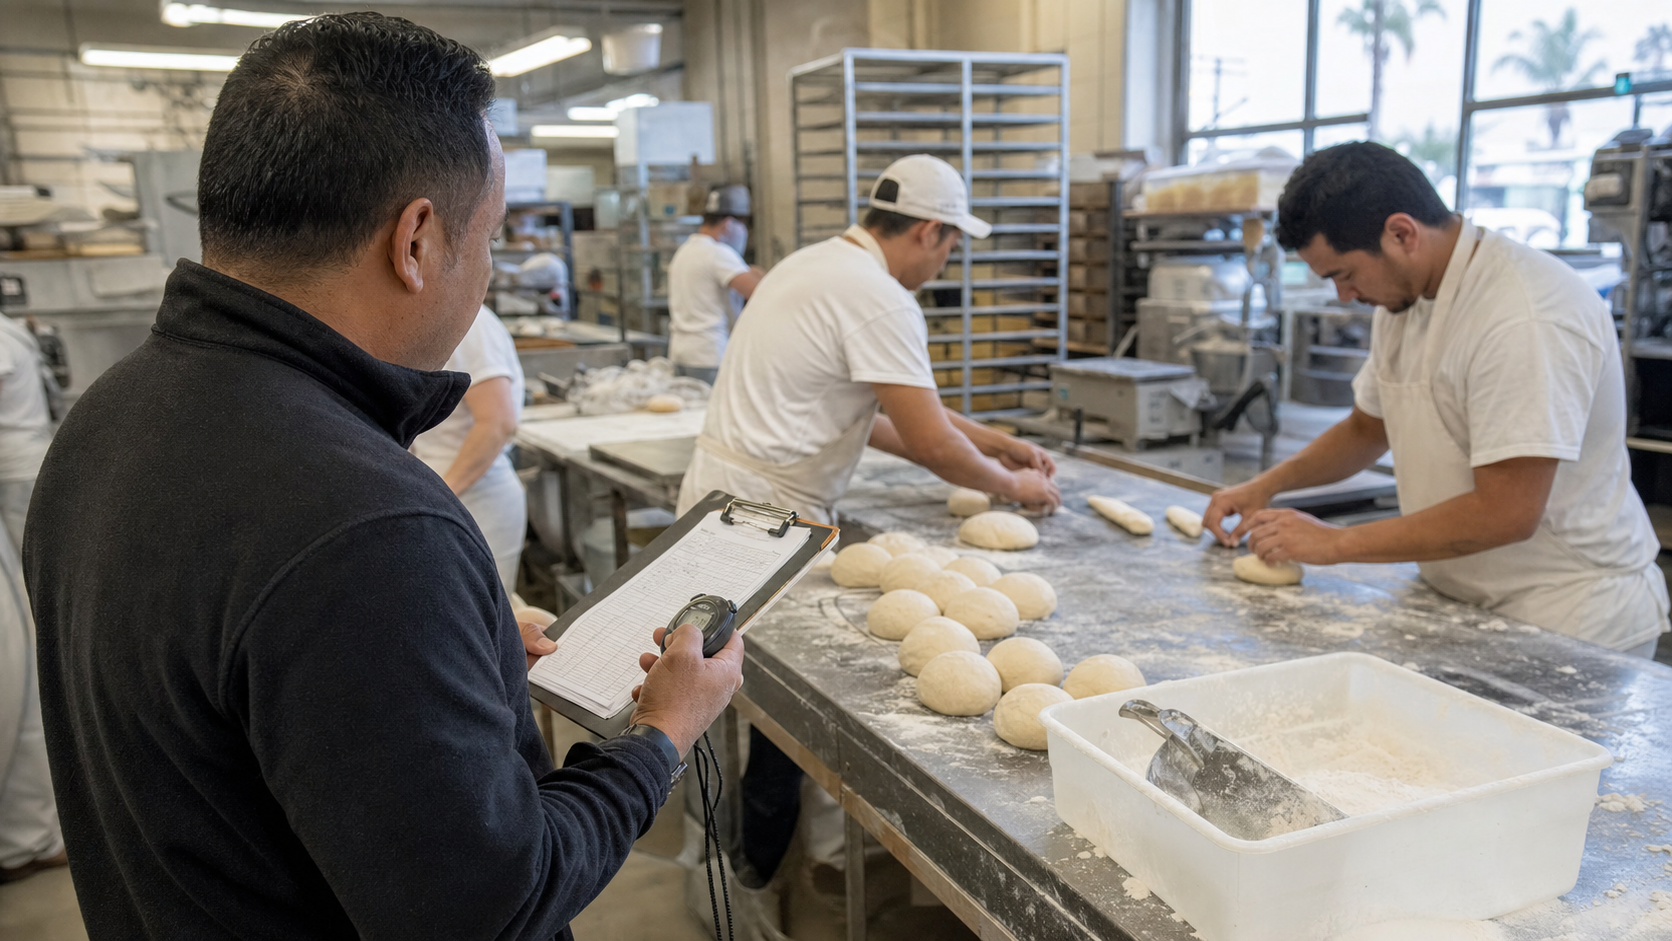
Capture Variance Close to the Work
Variance notes should be recorded during production or immediately after.
Common reasons:
- ingredient shortage
- mixer capacity constraint
- dough temperature issue
- proofing delay
- oven bottleneck
- shaping error
- overbake or quality hold
- customer order change
- count correction
If notes are added hours later, the reason often becomes vague. "Busy morning" is not a root cause.
Use Tolerances
Not every variance deserves a meeting.
Set practical tolerances by product:
- bread loaves: flag above 3-5%
- pastries: flag above 5-8%
- high-cost items: flag any recurring variance
- wholesale committed items: flag any short count
The tolerance should reflect product value, customer promise, and operational volatility.
Daily Production Variance Table
| Product | Planned | Actual | Variance | Reason | Action |
|---|---|---|---|---|---|
| Sourdough loaf | 180 | 174 | -6 | Low final dough yield | Check scaling loss |
| Brioche rolls | 240 | 264 | +24 | Standing order not updated | Correct account template |
| Muffins | 96 | 88 | -8 | Batter short | Review scoop weight |
The action column is what keeps the report from becoming passive documentation.
Connect Variance to Cost
Production variance affects margin.
Short output raises unit cost because the same labor and ingredient base produced fewer sellable units.
Overproduction creates waste, donation, discounting, or freezer pressure.
Track:
- cost of short yield
- value of overproduction
- labor variance dollars
- credits caused by short fulfillment
- waste from quality holds
When variance has a dollar value, it gets attention.
Separate Planning Errors from Execution Errors
The report should distinguish between two questions:
- Was the plan right?
- Did production execute the plan?
Planning errors include stale standing orders, missed order changes, wrong forecast, or incorrect batch scaling.
Execution errors include weighing mistakes, process drift, oven delay, or yield loss.
The fix depends on the category. A better bake sheet will not fix a shaping problem. Better training will not fix a stale demand plan.
Weekly Variance Review
Once a week, look for patterns:
- Which products miss plan most often?
- Which station creates the most variance?
- Which days show the most overproduction?
- Which wholesale accounts cause late plan changes?
- Which recipes need yield updates?
One variance event is a note. A pattern is a process problem.
Mistakes to Avoid
Tracking Too Much Too Soon
Start with the top 10 products or the products with the most complaints, waste, or overtime.
Blaming People Instead of Finding Causes
The point is to improve the system. If variance reporting feels punitive, teams will stop recording the truth.
Ignoring Positive Variance
Overproduction looks safer than a short count, but it still costs money.
Not Updating Standards
If actual yield is consistently different from the standard, update the recipe yield. A stale standard creates fake variance every day.
30-Day Setup Plan
- Pick the products that drive the most volume or pain.
- Define planned output and expected yield.
- Capture actual output daily.
- Add reason codes for variance.
- Review flagged items after each production day.
- Assign one corrective action per recurring issue.
- Update recipes, labor standards, or planning rules as evidence builds.
Production variance reporting helps the bakery learn from the day instead of just surviving it.
Try Diced OS to compare planned production, actual output, yield, and fulfillment performance in one workflow. Diced OS
Related posts
Bakery Batch Record Template: Capture What Actually Happened in Production
Bakery Labor Standards by SKU: Know Which Products Eat the Schedule
Bakery Production Downtime Tracking: Find Lost Hours and Recover Output

Bakery Weather-Based Demand Planning: Turn Forecasts Into Better Daily Production