
Restaurant Menu Engineering: How to Identify Your Most Profitable Items
Published: July 30, 2025
Every restaurant owner dreams of a menu where every item contributes meaningfully to profitability, but the reality is often starkly different. Hidden among your bestsellers are likely items that actually lose money with every sale, while your most profitable dishes sit unnoticed by customers. Menu engineering—the systematic analysis of menu item profitability and popularity—transforms guesswork into data-driven decisions that can increase restaurant profits by 10-20%.
Menu engineering isn't about creating the most delicious food possible; it's about creating the most profitable menu possible while maintaining quality and customer satisfaction. This analytical approach reveals which items deserve prominent placement, which need price adjustments, and which should be retired entirely.
The process requires understanding both the art and science of menu management: combining accurate cost calculations with customer psychology to create menus that maximize profitability while delivering exceptional dining experiences.
Understanding Menu Engineering Fundamentals
The Four Categories of Menu Items
Menu engineering classifies every menu item into one of four categories based on two criteria: profitability (gross profit margin) and popularity (sales mix percentage).
Stars (High Profit, High Popularity): Your menu champions that generate substantial profits and sell frequently. These items deserve prominent placement and active promotion.
Plow Horses (Low Profit, High Popularity): Popular items with disappointing margins. These require cost reduction strategies or price increases to improve profitability.
Puzzles (High Profit, Low Popularity): Profitable items that customers aren't ordering. These need better positioning, description improvements, or server training to increase sales.
Dogs (Low Profit, Low Popularity): The weakest performers that may be candidates for removal from the menu entirely.
Calculating Profitability Metrics
Accurate menu engineering requires precise cost calculations for every menu item:
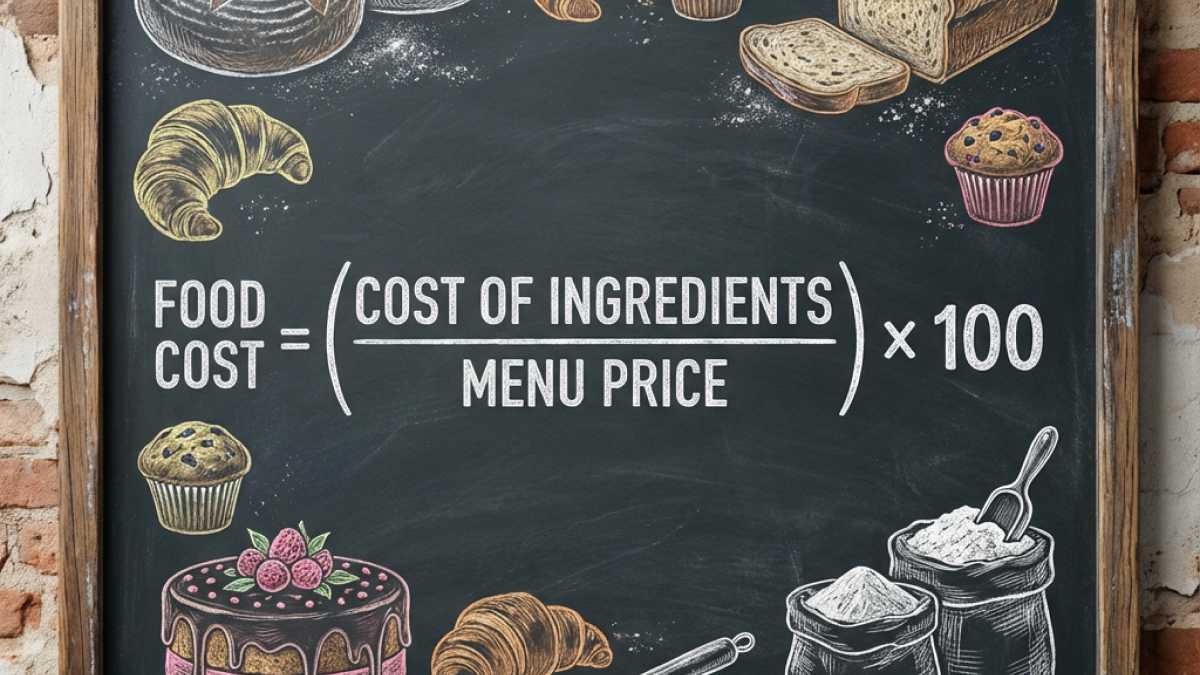
Food Cost: Total ingredient cost including all components, garnishes, and accompaniments Gross Profit: Selling price minus food cost Gross Profit Margin: Gross profit divided by selling price, expressed as percentage Contribution Margin: Gross profit per item sold
Example calculation for a pasta dish:
- Selling price: $16.95
- Food cost: $4.25
- Gross profit: $12.70
- Gross profit margin: 75%
- If this item sells 150 times monthly, contribution margin: $1,905
Understanding Sales Mix Analysis
Sales mix analysis reveals which items customers actually order:
Item Sales Count: Number of times each item is ordered during a specific period Total Menu Sales: Combined sales of all menu items during the same period Sales Mix Percentage: Item sales count divided by total menu sales Average Sales Mix: 100% divided by number of menu items
For a 20-item menu, average sales mix would be 5%. Items selling above 5% are popular; items below 5% are underperforming.
The Menu Engineering Process
Step 1: Data Collection
Gather comprehensive data for accurate analysis:
Sales Data: Minimum 4-6 weeks of POS data showing item-level sales Recipe Costs: Detailed cost calculations for every menu item including current ingredient prices Menu Prices: Current selling prices for all items Category Performance: Sales and profitability by menu section (appetizers, entrees, desserts)
Ensure data represents typical business patterns, avoiding holiday periods or unusual promotional periods that might skew results.
Step 2: Profitability Analysis
Calculate key metrics for each menu item:
Gross Profit Per Item: Selling price minus total food cost Weighted Average Gross Profit: Total gross profit from all items divided by total items sold Profit Classification: Items above average are "High Profit"; items below are "Low Profit"
Example calculation: Total gross profit from all menu items: $45,000 Total items sold: 3,500 Weighted average gross profit: $12.86
Items with gross profit above $12.86 = High Profit Items with gross profit below $12.86 = Low Profit
Step 3: Popularity Analysis
Determine which items customers favor:
Individual Item Sales Mix: Each item's sales as percentage of total menu sales Weighted Average Sales Mix: 100% divided by number of menu items Popularity Classification: Items above average are "High Popularity"; items below are "Low Popularity"
For a 25-item menu: Weighted average sales mix: 100% ÷ 25 = 4%
Items with sales mix above 4% = High Popularity Items with sales mix below 4% = Low Popularity
Step 4: Menu Item Classification
Combine profitability and popularity analysis to classify each item:
Stars: High Profit + High Popularity = Promote heavily Plow Horses: Low Profit + High Popularity = Reduce costs or increase prices Puzzles: High Profit + Low Popularity = Improve positioning and promotion Dogs: Low Profit + Low Popularity = Consider elimination
Strategic Actions for Each Category
Maximizing Stars
Stars are your menu's profit drivers and deserve special attention:
Premium Placement: Position prominently on menu with eye-catching design Server Training: Ensure staff can describe and recommend enthusiastically Upselling Opportunities: Create add-ons and modifications that increase check average Supply Chain Protection: Secure reliable suppliers to avoid stockouts Quality Maintenance: Monitor preparation standards to maintain customer satisfaction
Improving Plow Horses
Popular but unprofitable items need strategic intervention:
Cost Reduction Strategies:
- Negotiate better prices with suppliers for high-volume ingredients
- Modify recipes to use less expensive ingredients without compromising quality
- Reduce portion sizes while maintaining perceived value
- Eliminate expensive garnishes or accompaniments
Price Increase Tactics:
- Gradual price increases (3-5%) to test customer acceptance
- Bundle with sides or beverages to increase total revenue
- Reposition as premium items through improved descriptions
- Test higher prices on new menu designs before printing
Menu Repositioning:
- Move to less prominent menu positions to reduce sales volume
- Offer as daily specials rather than regular menu items
- Create "upgrade" versions at higher price points
Converting Puzzles
High-profit items with low sales need marketing attention:
Description Enhancement:
- Use appetizing, descriptive language
- Highlight unique ingredients or preparation methods
- Emphasize health benefits or dietary accommodations
- Include story or origin information
Visual Improvements:
- Add appetizing photos if using visual menus
- Use design elements (boxes, colors) to draw attention
- Position near popular items to increase visibility
- Create appealing table tent promotions
Staff Education:
- Train servers on ingredients and preparation methods
- Provide talking points for customer recommendations
- Offer incentives for selling puzzle items
- Include in daily pre-shift briefings
Sampling Programs:
- Offer small tastes to interested customers
- Include in catering samples or special events
- Create combination plates featuring puzzle items
- Partner with local food bloggers for reviews
Eliminating Dogs
Items with low profit and low popularity drain resources:
Removal Considerations:
- Customer sentiment analysis (are there loyal fans?)
- Kitchen efficiency impact (does item use unique ingredients?)
- Menu balance (does removal affect variety or dietary options?)
- Seasonal relevance (might performance improve during different seasons?)
Phase-Out Strategy:
- Remove from new menu printings
- Stop active promotion and staff recommendations
- Use remaining inventory through daily specials
- Monitor customer feedback for negative reactions
Advanced Menu Engineering Techniques
Contribution Margin Analysis
Look beyond individual item profitability to understand total contribution:
High-Volume Stars: Items that generate substantial total profit through frequency Strategic Loss Leaders: Unprofitable items that drive traffic and increase average check Seasonal Considerations: Items that perform differently throughout the year Labor Intensity: Factor preparation time into profitability calculations
Customer Journey Analysis
Consider how items work together in complete dining experiences:
Appetizer Strategy: How do starters influence entree selection and profitability? Dessert Attachment: Which entrees lead to dessert orders? Beverage Pairing: How do food choices affect drink sales? Check Average Impact: Which items increase or decrease total customer spending?
Psychological Pricing and Positioning
Menu engineering extends beyond cost analysis to customer psychology:
Anchor Pricing: Use high-priced items to make moderate prices seem reasonable Decoy Effect: Position items to make stars appear more attractive Menu Layout: Use design principles to guide customer attention Choice Architecture: Limit options in each category to reduce decision fatigue
Technology and Data Analytics
Modern Menu Engineering Tools
Digital solutions enhance traditional menu engineering:
POS Integration: Automatic sales tracking and real-time profitability analysis Recipe Management: Dynamic cost calculations when ingredient prices change Competitive Analysis: Market pricing comparison for similar items Predictive Analytics: Forecasting performance of new menu items
Key Performance Indicators
Monitor these metrics for ongoing menu optimization:
Overall Food Cost Percentage: Target 28-35% depending on restaurant type Menu Mix Variance: How much individual items vary from target sales percentages Profit Per Square Inch: Revenue generated per unit of menu space Customer Satisfaction Scores: Ensure engineering changes don't harm experience
Case Study: Riverside Grill
This casual dining restaurant implemented comprehensive menu engineering:
Initial Situation:
- 45-item menu with wide variety
- Overall food cost: 38% (above target of 32%)
- Uneven sales distribution with 8 items generating 60% of sales
- Kitchen complaints about complexity and prep time
Analysis Results:
- Stars (8 items): Generated 65% of total gross profit
- Plow Horses (12 items): Popular but averaged 42% food cost
- Puzzles (15 items): Averaged 25% food cost but only 15% of total sales
- Dogs (10 items): Combined for less than 5% of sales with 45% average food cost
Actions Taken:
- Promoted stars through menu redesign and server training
- Increased prices on 6 plow horse items by 8-12%
- Repositioned 8 puzzle items with better descriptions and placement
- Eliminated 8 dog items from the menu
- Simplified kitchen operations by reducing menu to 32 items
Results After 6 Months:
- Overall food cost reduced to 31%
- Gross profit increased by 18%
- Kitchen efficiency improved with simplified operations
- Customer satisfaction scores remained stable
- Staff reported easier menu management and training
Financial Impact:
- Annual revenue: $1.2 million
- Food cost improvement: 7 percentage points
- Additional annual profit: $84,000
Implementation Timeline
Month 1: Data Collection and Analysis
- Gather 6-8 weeks of detailed sales data
- Calculate accurate recipe costs for all menu items
- Complete initial menu engineering analysis
- Identify improvement opportunities
Month 2: Strategic Planning
- Develop action plans for each menu category
- Design new menu layouts emphasizing stars
- Plan pricing changes for plow horses
- Create promotion strategies for puzzles
- Determine which dogs to eliminate
Month 3: Implementation
- Launch new menu designs
- Implement pricing changes
- Begin staff training on new promotions and descriptions
- Start phase-out process for eliminated items
Month 4-6: Monitoring and Optimization
- Track sales performance of modified items
- Monitor customer feedback and satisfaction
- Adjust strategies based on results
- Plan next round of menu engineering
Common Pitfalls to Avoid
Analysis Errors
Insufficient Data: Using too short time periods or atypical sales periods Inaccurate Costs: Failing to include all ingredients and components in calculations Ignoring Labor: Not factoring preparation time into profitability analysis Static Analysis: Failing to update costs when ingredient prices change
Implementation Mistakes
Too Many Changes: Overwhelming customers and staff with extensive modifications Poor Communication: Failing to train staff on new menu features and changes Ignoring Customer Preferences: Removing popular items without considering loyalty impact Inadequate Testing: Making major changes without pilot testing
Ongoing Management Issues
Lack of Monitoring: Failing to track results and adjust strategies Inflexible Systems: Not adapting to seasonal changes and market conditions Cost Creep: Allowing ingredient costs to increase without corresponding price adjustments Menu Drift: Adding new items without proper analysis and integration
Conclusion
Menu engineering transforms menu management from guesswork into strategic advantage. By systematically analyzing the profitability and popularity of every menu item, restaurants can maximize profits while maintaining customer satisfaction.
The process requires accurate data, careful analysis, and strategic implementation, but the results justify the investment. Restaurants that embrace menu engineering typically see profit improvements of 10-20% within the first year.
Modern technology makes menu engineering more accessible than ever. Platforms like Diced OS provide real-time cost tracking, sales analysis, and profitability insights that enable continuous menu optimization. These tools eliminate the manual calculations that previously made menu engineering time-consuming and error-prone.
Remember that menu engineering is not a one-time project but an ongoing process. Ingredient costs change, customer preferences evolve, and competitive pressures shift. Regular menu analysis—quarterly or semi-annually—ensures your menu continues delivering maximum profitability.
Start with accurate cost calculations for your current menu items, then analyze sales patterns to identify opportunities. Even small improvements in menu mix and pricing can deliver substantial profit increases that compound over time.
Your menu is your restaurant's primary profit-generating tool. Make sure it's working as hard as you are.
Ready to engineer your menu for maximum profitability? Visit dicedos.com to discover how our platform provides real-time cost tracking and sales analysis to optimize your menu's profit potential—all from your mobile device.
Related posts
Seasonal Menu Planning for Restaurants: Maximize Profits While Minimizing Food Costs

Menu Profit Analysis for Wholesale Bakeries
The Complete Guide to Food Cost Percentage for Bakeries

Data-Driven Menu Decisions for Small Bakeries